Data. Whether you're talking about the Industrial Internet of Things, Industry 4.0, Smart Manufacturing or Digital Manufacturing, data is at the core. None of these industrial initiatives happen without historical and ongoing sources of data collection. And the good news is, as a manufacturer or processor, you are loaded with data. In many cases, decades of data.
But how do you do anything with it? There’s the rub. When it comes to deriving insights from all the data you have, most manufacturers probably feel like Coleridge’s ancient mariner—water, water everywhere and not a drop to drink.
This is such a critical issue because, for good data analysis to take place with any of the multitude of software options on the market today, “historical data must meet exceptionally broad and high quality standards,” said Thomas C. Redman, president of Data Quality Solutions, in his Harvard Business Review article “If Your Data Is Bad, Your Machine Learning Tools Are Useless.”
In his article, Redman says, “Reasons [for poor quality] range from data creators not understanding what is expected, to poorly calibrated measurement gear, to overly complex processes, to human error.” To compensate for this, data scientists must cleanse the data, but doing so neither detects nor corrects all the errors. Even having done a good job of cleaning the data, “it can still be compromised by bad data going forward.”
As a result, all of this effort just to prepare data for machine learning or analysis often “subverts the hoped-for productivity gains,” said Redman.
While attending the OSIsoft User Conference in San Francisco this spring, I spoke with Michael Risse, chief marketing officer at Seeq, a supplier of process data analytics software. Seeq bills itself as a company whose data analytics technology is “intuitive” and “visual” and “allows users to search their data, add context, cleanse, model, find patterns, establish boundaries, monitor assets, collaborate in real time, and interact with time series data like never before.”
With Redman’s points in mind, I asked Risse what, based on his experience with users across the batch and continuous process industries, are the most common data management issues users have to address to begin reaping the business benefits of data analytics?
“Data management—and I am being specific here—is not the issue,” said Risse. “For example, many of our customers have OSIsoft PI and their data is well managed, secured and collected. The industry is awash with data that’s well managed, it’s getting the insights out of the well-managed data that is the issue.”
What I wanted to learn from Risse in discussions following the conference was how Seeq helps its users prepare data for analysis. Considering the issues raised by Redman, this is the critical bridge that must be crossed, not just with historical data—but with the aggregation of all data moving forward, before any useful analysis can be performed.
“Preparing data takes a number of steps,” said Risse. “Each step in the preparation process is a feature in Seeq.” These steps and features, according to Risse, are as follows:
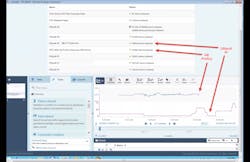
- Connecting to the data sources. “This can be harder than it sounds because it often requires dealing with unlike data types and proprietary interfaces,” said Risse. (See the Multi-Historian diagram above for an example of how Seeq incorporates multiple historian sources of data.)
- Dealing properly with time series data. Risse noted here that he is specifically referencing issues “with aligning time series data coming from different sources, data with different sample rates, and converting or managing units of measure (metric, English, /sec or /hour, etc).
- Data cleansing. To get the data right, Risse said outliers have to be removed, gaps in the data have to be fixed and “data smoothing” may need to be done if the data is noisy. “There's a lot that goes into this,” he said, while clarifying that, in these data cleansing processes, Seeq does not change the source data in the process.
- Soft sensor creation. “Prior to data analysis, calculations may be required to create ‘soft sensors,’” said Risse. A soft sensor refers to software where several measurements are processed together for use in calculating new quantities that need to be measured. As an example, Risse said that three signals can be used to calculate an outcome that will be used in the analysis, such as an average, derivative, addition, conversion, etc.
- Other steps. Considering Redman’s points above, preparing data properly for analysis cannot be entirely addressed by points—no matter how critical—that can be counted on one hand. Other steps that may be necessary to properly prepare your data include “real time collaboration with peers, documenting the preparation work, or focusing the data on particular asset modes or other criteria so that the analysis is centered on a specific issue and only uses that part of the data,” said Risse. As an example of how Seeq focuses on specific issues or parts of the data, the software’s “capsules” are a feature that, according to the company, “represent a defined slice of time, or a time period of interest.”
Though Seeq claims it makes the data analysis process relatively simple for users, the toughest part for users may be in assessing all the suppliers in the market. Even Risse admits that “there are a lot of data analytics solutions available and incredible innovation occurring in the industry.” Which explains why Seeq is focused on working with time series/process data. “Seeq is focused on a narrow range of applicability—only for process data,” said Risse. “This makes it easy to use. By contrast, a general purpose tool for IT data sources can often work with other types of data (e.g., process, financial, retail, etc.), but not with time series data.”
Leaders relevant to this article:


