Process manufacturing operations may be oversimplified as entailing raw materials, a production process, and finished goods. The same model can be applied to using production data to improve process and business outcomes: data, analytics, and insights.
The issue is the value of insights is so high that enthusiasm for claiming credit for the “analytics” between data and insights has gotten out of control. Analytics, the systematic computational analysis of data or statistics (according to Merriam Webster), derives from the Greek analýein, which means “to loosen, dissolve, or resolve into constituent elements.” Leave it to marketing to mess up what Aristotle taught almost 2500 years ago.
The result is “analytics” is now everything and everywhere in software products, platforms, and cloud services. You’d be hard pressed to find software that doesn’t claim analytics features or benefits as part of its offering. The abuse of this benign word means it’s difficult to tell what analytics means, what’s included, or what’s required. To overcome this, “analytics” is now frequently qualified to define the exact type of analytics, a trend which can be broken into three categories.
First, there is the trend towards modern analytics that taps innovation in data science and computing resources; for example “advanced analytics,” which has come into use in the last several years. McKinsey & Company defines advanced analytics as “the application of statistics and other mathematical tools to business data in order to assess and improve practices ... [users can use advanced analytics] to take a deep dive into historical process data, identify patterns and relationships among discrete process steps and inputs, and optimize the factors that prove to have the greatest effect on yield.
The issue with this definition is that it assumes a user has the skills for the statistics or machine learning or other technologies required to leverage advanced analytics. Therefore, Gartner has begun using the term augmented analytics, which taps the same innovation themes but puts the analytics in the context of the user experience with business intelligence applications or tools. As Gartner explains: Augmented analytics is the use of enabling technologies such as machine learning and artificial intelligence to assist with data preparation, insight generation, and insight explanation to augment how people explore and analyze data in analytics and business intelligence platforms.
Perhaps the best example of augmented analytics is the simple Google Search Bar—the user doesn’t have to know what computations are taking place behind the web page they use to get results.
The second transition in analytics language comes from recognizing that analytics is not a static end point or insight. I would get in trouble inserting a graphic from a vendor that uses this approach, but there are dozens of examples. This approach suggests a hierarchy, a “better than” analytics structure which starts with descriptive analytics (i.e., writing reports), then diagnostic analytics (root cause analysis), then predictive analytics (also predictive maintenance), and finally prescriptive analytics to tell the user what to do (see Figure 1). There may be other, intermediate steps included, but the point is there is a fixed path to greater analytics sophistication.
This hierarchical view of analytics may make for compelling marketing materials (“Find Your Analytics Maturity!”) but it’s simply not realistic. A realistic view of analytics is an iterative, looping, collaborative process where an engineer starts with one analytics type, switches to another, goes back to the first, then does something else, or otherwise moves among analytics types to accommodate the changes in plant priorities, raw material costs, formula changes, and other factors.
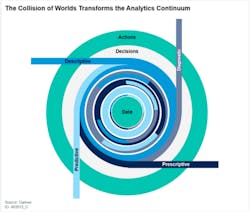
Even in the most static environment, process engineers with experience in Lean or Six Sigma techniques knows that good enough today won’t be good enough tomorrow. Again, Gartner is leading the discussion on an iterative approach to analytics. The analytics aren’t static and hierarchical, they are circular and subject to impact from new requirements.
Improved outcomes
The third transition in analytics is in the desired outcome and impact of analytics. The static view, summarized in the prior paragraph, is defined both by its hierarchy and its defined outcome. The highest level, the brass ring, of this approach is “prescriptive” analytics, as if there was a way to define what the user should do given a certain set of data. This is simply not a realistic objective.
At any point in time there will be context known only to the user or subject matter expert, and only at the time of the analysis. This context must be considered when making the right decision for optimizing the production or business outcomes. If the analytic recommends a shutdown of the line when an asset is working but in need of maintenance, how does the decision get made in the context of production objectives and customer commitments? Only the process engineer or plant manager has the right business context to answer this type of question.
Therefore, the desired end point of analytics is not “tell me what to do” but instead “give me insights to inform my decision” based on the process engineer’s ability to tradeoff among outcomes. Another critical aspect of this optimization focus is insights must be achieved in time to make a decision that impacts the outcome. The unsatisfactory—and common—alternative occurs when the analytics take longer than the process to complete, with results delivered after the fact.
Analytics tools therefore need to be available as self-service, ad hoc solutions to plant personnel, and presented in time to make a difference. The boring and banal “actionable insights” from two decades of automation vendor marketing must give way to a focus on empowering and supporting the process engineer or subject matter experts inclusion and perspective in the trade-offs required for optimizing higher level outcomes.
These three transitions in the language and innovation of analytics are not exclusive to each other; in fact they are converging in a new generation of software applications that assemble the key capabilities as one offering. Thus, innovative augmented analytics accessible to process engineers or subject matter experts in the plant will support all types of analytics—for past, present, and future data—to constantly tune and adjust the analytics to match plant requirements (see Figure 2).
And of course, insights from these new software applications will be accessible to end users so they can provide insights in time to improve production and business outcomes. Analytics has had a rough go of it in the last couple of decades with marketing abuse and over-saturation of messaging, but a new generation of solutions will deliver on the promises and potential of innovation.
