Guided Analytics Software Streamlines Equipment Maintenance
Aveva showcased its Insight guided analytics tool at PACK EXPO Connects. This software gives users access to all of an organization’s production and performance data in user-defined views so that the information delivered is relevant to the specific user.
Conducting the demo in Aveva’s virtual booth at the event, Omar Almasri, technical sales consultant, asset performance management at Aveva, explained that the cloud-based Aveva Insight software has been extended beyond its initial design to collect, store, visualize, and analyze real-time process and production data and now features an “immersive guided analytics toolset that leverages fit-for-purpose content to automate remediation of asset performance issues. Failure modes, predictive models, asset types, remediation maintenance plans, and fault diagnostics are now available in Insight's cloud-based asset library. This means that information for general purpose assets such as pumps, motors, and drives can be leveraged to generate actions based on analytics or create condition-based alerts.”
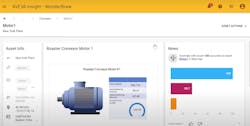
Walking demo attendees through the basics of Aveva Insight, Almasri showed how the software has sent him an email notification indicating a potential issue with “motor number 1” on the production line due to a potential bearing anomaly. In the email, he sees details showing the specific operating parameters that have been crossed by the motor, the consequences of motor failure to the line, and prescriptive actions he can take to solve the issue.
In addition to personalizing the view into the system for each individual user, Aveva Insight “keeps track of the data related to the assets that the user has viewed and analyzed in the past,” said Almasri.
With each of these notifications in Insight, users are provided with a thumbs up or thumbs down option to inform the system if the information it provided to the user was helpful or not. The system learns from these inputs to improve its delivery of information most relevant to that specific user.
Describing how Aveva Insights’ guided analytics are initially modeled and from which data points the system learns, Almasri said that the anomaly score of an asset can range from zero to 100. “It’s essentially a health indicator for assets,” he said. “If the score is zero, it means that the asset is not deviating from the norm whatsoever. But if the anomaly score is as high as 100, it means that the asset is deviating completely from the norm.”
Once these parameters for a specific device are established, Insight can provide individual anomaly scores for the top three tags and signals that are contributing to any asset deviation. “Users can select the tags they want to analyze further to get the model anomaly score and configure alerts if the anomaly score crosses a certain threshold from which the user wants certain actions to take place. Prescriptive actions can also be added to the alert to direct maintenance and repairs,” said Almasri.
Another example of Aveva Insight provided by Almari was done from the point of view of an operational shift supervisor. In this role, a user can click on a production line in Insight and see how it is tracking to key performance indicators. Here, Almasri noted that the performance of the line is not where he wants it to be and neither is the OEE (overall equipment effectiveness). “I can look at these KPIs through a real time status update and I can trend this data or manipulate it statistically as I see fit as the supervisor,” he said. “I can also add comments and submit them to others on team who are responsible for repairs.”


