Collecting and analyzing data from industrial assets on the plant floor hardly registers as cutting edge. For years, plant floor managers and their counterparts have analyzed industrial machine data to be alerted to production snafus, identify quality glitches, or as a guide for tweaking assets with the goal of boosting performance.
As industrial assets are digitized with sensors and connected via the Industrial Internet of Things (IIoT), manufacturers still want to analyze machine data to create production efficiencies, reduce downtime, rein in costs, and promote better decision making. Yet the goal posts have shifted significantly when it comes to scale. Instead of a plant manager or maintenance worker analyzing historical data from a specific asset in a spreadsheet to make a modest change down the road, today’s manufacturers are striving for wholesale transformation. Their aim is to create flexible and intelligent operations where networks of assets and systems can be holistically automated and optimized in near-real-time.
The engine for such intelligent operations in areas like predictive maintenance, real-time quality control, and scenario testing for root cause analysis is advanced analytics, powered by artificial intelligence (AI) and machine learning. While the analytics category remains somewhat nebulous in the industrial world, use cases are already sparking huge interest and growth. According to IoT Analytics, the industrial AI and analytics market hit $15 billion in 2019, with the top use cases being predictive maintenance, cited by nearly a quarter of respondents (24.3%), followed by quality inspection and assurance (20.5%), manufacturing process optimization (16.3%), and supply chain optimization (8.4%).
The surge in industrial analytics use is rooted in the desire to capitalize on the sheer amount of data generated by plant floor or field-based industrial assets, including robots, automation cells, oil rigs, and wind turbines. As manufacturers across industries ramp up digitization efforts, IDC Insights estimates that the typical plant is generating more than a terabyte of data a day with expectations that the number will multiply by a factor between five and 10, depending on industry, over the next five years.
“That’s what’s driving companies to develop or buy these [analytics] tools—without them, there’s nothing else to do with the data,” says Kevin Prouty, group vice president, manufacturing insights and energy insights at IDC. “It’s too much data for an engineer with an Excel spreadsheet to analyze.”
Enterprise analytics vs. industrial analytics
Most manufacturers agree with the notion that the bounty of data can be leveraged for bottom line impact, whether that’s increasing profits, productivity, or both. The problem is the data is scattered across silos, in different formats, without context, and with much of it stored as time-series data, which isn’t handled adequately by most enterprise analytics and Big Data tools designed for structured and unstructured data. In addition, Excel has been the analysis tool of choice in this space for decades, but it’s inefficient and any insights remain isolated to a single engineer tackling one specific problem.
There are also differences in the approach enterprise information technology (IT) and operations technology (OT) groups take for data collection and analysis. Most enterprise analytics efforts involve ingesting data, normalizing it, and putting it in a centralized repository or data lake, most likely in the cloud, to make it accessible to a variety of business users for different types of analysis. From an OT perspective, the data collection and analytics efforts have been mostly local and tactical. “OT people know how to build an analytical model for a single machine in a single factory for a single problem and they do it in Excel or by hand with an open source platform,” says Marcia Walker, global industry principal for the manufacturing practice at SAS. “When you ask them how they’re going to take that and apply it to all the machines in a factory and to their factories across the globe, they stare at us like deer in the head lights.”
Another big gap between industrial analytics and general enterprise analytics is an understanding of the specific nature of the machines and the ability to provide context to the data collected in historians and supervisory control and data acquisition (SCADA) systems. Unlike structured content from financial systems, time series data lacks context for understanding how the raw data set relates to a specific process or condition—for example, what factors might be present to impact the operation of a pump. Without the proper context, it’s impossible to fully leverage data to drive operational performance, condition monitoring, or predictive or prescriptive maintenance applications.
“Context is required for problem solving,” says Bry Dillion, vice president of cloud, community, and channels for OSIsoft, which markets the PI System for collecting and centralizing time series data from diverse sources. “If you’re streaming data associated with a pump, you have to understand how the data set relates to the process to get that context. If you just optimize the flow through pump and don’t know the calibration or throughput, you could potentially optimize the pump to the point where the pump breaks. You can’t just bring in raw data and expect machine learning to figure it out.” (Editor’s note: At press time, Aveva had just announced its pending acquisition of OSIsoft. Read more at http://awgo.to/bSDYc.)
Core components
Industrial analytics can take a variety of forms, but there are core components and attributes that seem to be universal across platforms. While a lot of the heavy lifting in enterprise analytics happens in the cloud, industrial analytics software requires significant edge processing capabilities given the need to process and analyze data in near-real-time and close to the source to avoid latency and security issues.
“When you are talking about the industrial space, you are almost always talking about something that has a combination of on-premise and cloud,” says Ed Cuoco, vice president of analytics for PTC. “You need a solution that’s balanced and that can send data to the cloud for processing along with an edge ability to drive insights very close to or within the machine.”
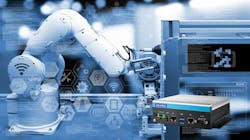
Advantech makes the case that AI-enabled edge processing delivers better performance than cloud-based industrial analytics while also ensuring a higher level of security. Advantech’s Edge AI Systems, powered by the Nvidia Jetson platform, can serve as a replacement for traditional visual quality inspections performed by plant floor workers. In one such scenario, an edge server system, buttressed with various AI models, performs real-time inspection on baked goods in a cookie factory, automating the process of setting bake times and oven temperatures to ensure more consistent, high-quality cookie production.
“We’re focused on the edge instead of the cloud so we can protect data and keep it secure and confidential,” says James Yung, product manager of Advantech’s server-grade products. “If you send data to the cloud, it can take a long time to come back with a response.”
Given the heterogeneity of plant floor data, an industrial analytics platform must have both an ability to ingest disparate information types with some means of normalizing and contextualizing data. Specifically, customers need to know the context at the moment when data is generated from a device or a production line, however, it remains difficult to gather high-speed OT contextual data from different edge devices let alone package it in a structured way to pair with third-party industrial data sources or send it upstream to IT applications for enterprise-wide insights.
To solve this problem, automation partners Rockwell Automation and PTC have created smart objects, a flexible data model that automatically discovers and gathers high-speed OT data with rich context, allowing it to be consumed by upstream IT applications like enterprise resource planning and product lifecycle management systems. “Smart objects unlock the contextualized OT data you’re gathering at the edge in a fast manner and makes it compatible with all IT apps downstream,” explains Gaurav Verma, director, digital transformation at Rockwell Automation. “IT apps can glean a lot of business insights at the enterprise level, but without smart objects, it’s not possible.”
Sight Machine also leans heavily on a modeling layer to differentiate its manufacturing analytics platform. The software performs an automated and continuous data intake process, which includes employing expert systems and machine learning classifiers to prepare and contextualize process and product data. The end result is a digital twin of the plant floor, which using machine learning and advanced analytics, can surface anomalies and provide insights to help reduce downtime. “We apply data models and put common structures in place to harmonize data,” says Jon Sobel, Sight Machine’s CEO. “It’s the application of structure to data so you can analyze it effectively that’s been so difficult for people.”
Regardless of their different approaches, most, if not all, industrial analytics tools and platforms incorporate some form of AI and machine learning to help uncover patterns in the deluge of asset data to build models of assets and production floor processes and to automate processes as part of more intelligent operations. The AI-driven analytics model can become a mission-critical element in the production line, creating a digital twin that allows, for example, a brewery to simulate, test, and optimize its processes as well as analyze hundreds of thousands of parameters to understand and predict influences on beer quality, explains Henning Ochsenfeld, head of data science and machine learning engineering at Siemens Digital Industries. “It’s nothing a human could do,” he explains. “You need to model the relationship between existing key performance indicators and the huge amount of data acquired on the production line.”
Another element of emerging industrial analytics platforms that is proving to be critical is some semblance of citizen developer capability that allows OT professionals, not just IT and data scientists, to easily model problems and visualize insights. Siemens’ Mendix low-code platform serves that role in its industrial analytics portfolio.
Differing from the platform approach, Seeq bills its data analytics software as being specifically designed to help process engineers and subject matter experts interact with and model time series data at scale. Instead of competing with some of the large industrial analytics platforms, Seeq connects to data stored in variety of process historians and SCADA systems as well as IIoT platforms like PTC ThingWorx and Siemens Mindsphere, according to Michael Risse, Seeq’s vice president and CMO.
Given the complexity of factory automation and the diversity of industrial data, there will be no one analytics product that fits the bill for all use cases and all scenarios. Rather, experts say organizations need to consider the long-term strategy and the questions they’re looking to answer to line up the right tools for the job. “Don’t draw a bright line between tool sets—it’s important to put everything on table and see how they play together,” says Steve Deskevich, vice president of product management for power and the oil and gas business unit at GE Digital. “Don’t look at industrial analytics as a side project because, if you do, you’ll be spending a lot of time and energy on a cool engineering project, but not necessarily changing how the business works.”
Leaders relevant to this article:


