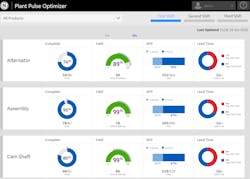
Dashboards are nothing new in manufacturing, but a new emphasis on their importance to production optimization is clear. Automation technology suppliers are not just rolling out upgraded versions of their previous dashboard technologies, they’re releasing entirely new products with distinct capabilities.
But there’s more to this trend than technology suppliers’ cycle of new product releases.
According to LNS Research, 50 percent of manufacturers have implemented or are implementing cross-functional groups to support operational excellence initiatives. However, only 18 percent have software or processes in place to deliver relevant KPIs (key performance indicators) to all personnel in real time. This gap begs the question: Why are so many manufacturers focused on improving operational excellence but not investing in the tools to help deliver on these goals?
Deepti Patil, senior manager, product management and user experience at GE Digital, says the disconnect stems from a lack of focus on lean manufacturing—measuring current performance to institute continuous improvements in the process. As a result, “a lot of manufacturing dashboarding projects turn out to be more of a science project than a structured approach to making improvements. Typically, organizations start by defining a host of measurements that can be tracked to improve a process. The problem is that each manufacturing site does this same exercise on their own and without consistency.”
This disconnect is the market opportunity many technology suppliers are targeting with their visualization products. When it comes to making the most of any visualization technology, the key—for users and suppliers—is to “understand what should and shouldn’t be on the dashboard to provide a quick and easy overview for operations personnel to immediately understand what’s going on and to take the right action,” Patil says.
To help manufacturers address this issue, GE Digital has released Plant Pulse Optimizer—the latest module in the company’s Brilliant Manufacturing Suite. According to Patil, Plant Pulse Optimizer provides a “panoramic view of all production activity for all factory personnel via real-time, multi-shift based KPIs (e.g., machine, material, labor, and product intelligence) as scorecards.The module provides insights focused on production analytics to organize manufacturing data into a structure to provide information on inventory, yield and achievement of production plans.”
Patil points out that the module is device and back-end agnostic, meaning that it can be connected to both GE and non-GE manufacturing operations systems. This openness is achieved through the use of application programming interfaces created by GE using PTC’s ThingWorx platform for IoT applications. (GE announced its partnership with PTC around ThingWorx during its Minds + Machines event last fall.)
With so many visualization offerings on the market, I asked Patil to help clarify the difference between two of GE Digital’s visualization products in its Brilliant Manufacturing Suite—Plant Pulse Optimizer and Efficiency Analyzer. “The Brilliant Manufacturing Suite is a combination of cloud-based and on-premise manufacturing operations management solutions,” she says. “They work together as a combined portfolio and can also be used independently.”
While both Plant Pulse Optimizer and Efficiency Analyzer are focused on increasing productivity, improving decision support and providing greater visibility of plant data related to performance objectives, the main differentiators are that Efficiency Analyzer focuses on overall equipment effectiveness (OEE) and providing visibility into asset downtime and availability, while Plant Pulse Optimizer is focused on real-time visualization of plant floor key performance indicators to improve production performance, yield and quality.
Sponsored Recommendations
Leaders relevant to this article:

